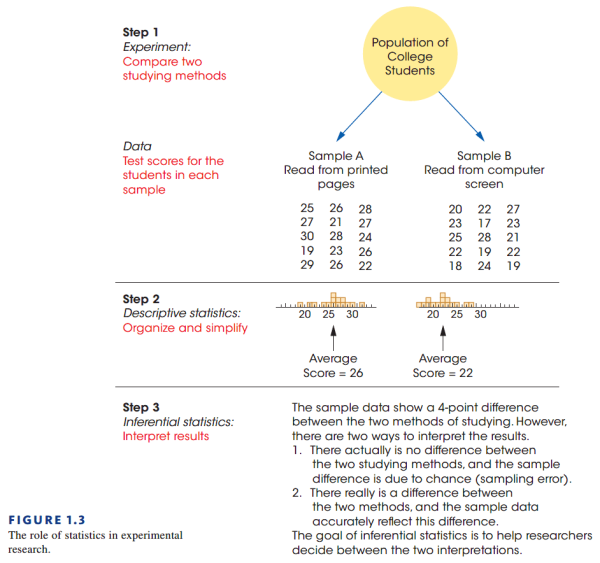
目录
Introduction to statistics
S.B.S book Chapter 1 notes
Statistics、Science、and Observations
Statistics的定义
统计 Statistics 可以称为 Statistical Procedures 的简称。在数学上,Statistics 指用于组织(organizing)、总结(summarizing)和解释(interpreting)信息的一系列的数学过程。
统计有两个目的:
- 组织与总结信息,并将得到的结果作为反馈。
- 统计得到的结果可以作为研究结论的论据。
Populations and Samples
行为科学的研究的问题一般是对指定的群体提出来的。比如我们要研究为什么会导致大学生的学术失信,我们就要关注指定的大学生群体。这个指定群体,我们称为总体(Populations )。定义如下:
A population is the set of all the individuals of interest in a particular study.
不过在研究的过程中,有时候我们会发现总体的数量很大;这种情况下我们往往无法完成对总体里所有个体(individual )的研究。因此,我们需要在总体挑选一个小一点的,更利于管理的组来进行分研究。我们将这一个特别挑选出来的组称为样本(Sample )。定义如下:
A sample is a set of individuals selected from a population, usually intended to represent the population in a research study.
Variables and Data
除了关注指定的组以外,有时候一些外界的条件也会对研究总体中的个体产生影响。比如,天气可能会影响人的心情。我们将这种外界不定的因素称为变量(Variables )。定义如下:
A variable is a characteristic or condition that changes or has different values for different individuals.
变量可以:
- 根据个体不同而不同(比如人的身高、体重)
- 可以作为环境条件影响个体(比如天气,时间,温度)
可以看出来,变量存在着非常多的形式和种类。为了更好的表示变量的变化,我们需要建立一种衡量变量变化的手段。我们将衡量个体的标准称为分数(Score、Raw score or Datum),而由这些分数组称的数据组,我们称为数据 (Data、Data set)。定义如下:
Data (plural) are measurements or observations. A data set is a collection of measurements or observations. A datum (singular) is a single measurement or observation and is commonly called a score or raw score.
因为研究往往都是通过获取分数来得到结果,因此我们的总体和样本也被称作分数的总体和分数的样本。
Parameters and Statistics
- Parameters 称为总体的平均分数
- Statistic 称为个体的平均分数
A parameter is a value, usually a numerical value, that describes a population. A parameter is usually derived from measurements of the individuals in the population.
A statistic is a value, usually a numerical value, that describes a sample. A statistic is usually derived from measurements of the individuals in the sample.
Descriptive and Inferential Statistical Methods
通常来说,统计学中有两类用于反映数据的方法。
第一种方法称为描述统计(Descriptive statistics ),这种方法主要包括了组织,总结,简化数据。
Descriptive statistics are statistical procedures used to summarize, organize, and simplify data.
描述统计学主要的特点:
- 用某种形式组织数据,使其更加简化(比如直方图,表格等等)
- 计算一组数据的平均分数(平均分数可以用于描述一组数据的值)
第二种方法被称为推断统计(Inferential statistics ),这种方法通过样本的数据去预测整个总体的特征。
Inferential statistics consist of techniques that allow us to study samples and then make generalizations about the populations from which they were selected.
- 使用描述统计方法简化数据
- 使用推断统计方法解释结果
Sampling error
前面我们提到过,在某种情况下总体的数量非常巨大,导致我们不能对总体中每一个个体进行具体的测量。因此,我们希望通过分析样本来获得总体的特征。但相较于总体,样本的数量与信息都有限,我们不能通过样本的数据来完美表现总体的特征。这个过程中样本和总体的特征总会有一些差异,我们将这种通过样本研究总体产生的差异,称为抽样误差(Sampling error)
Sampling error is the naturally occurring discrepancy, or error, that exists between a sample statistic and the corresponding population parameter.
抽样误差的几个特点:
- 同一总体的不同样本之间可能会有抽样误差
- 样本与总体之间可能会有抽样误差
Data Structures, Research Methods, and Statistics
Individual Variables: Descriptive Research
- 某些个体变量可以用天然存在的事物描述
- 个体变量分数的结果如果包含具体数字,可以用统计方法的技术来表述
- 个体变量分数的结果如果不包含具体数字,一般用比例(百分比)描述
Relationships Between Variables
有时候,两种变量中可能存在关系;比如小学学生的成绩是否与其早餐的质量有关系。为了研究这样的关系,研究者需要观察,也就是衡量两个变量的标准。这导致了衡量的标准的可以分为两种数据结构(Data Structures ):
- The Correlational Method
- Experimental and Nonexperi-mental Methods
The Correlational Method
相关研究法(The Correlational Method)通过观察两个变量的一组个体来研究这两个变量之间的关系。比如下图:
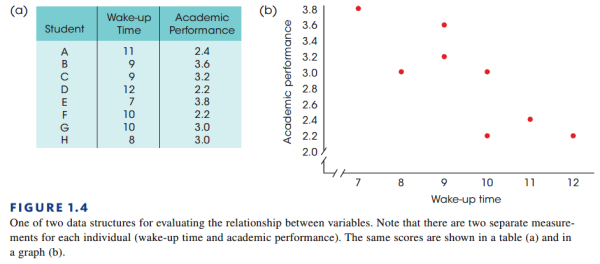
上图右边的点称为 scatter plot,每一个 scatter plot 通过坐标的形式表现了学生的起床时间和成绩。将一组个体的两个不同变量都添加到这个图表中,通过观察就能看出一定的规律:随着起床的时间延迟,学习成绩下降。可以说,观察是相关研究法的主要特点。
In the correlational method, two different variables variables are observed to determine whether there is a relationship between them.
Statistics for the Correlational Method
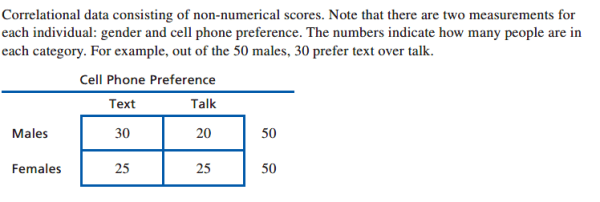
当相关研究的数据包含数字分数的时候,两个变量的的关系通常被描述为一个 statistic,我们称之为相关度(Correlation)。不过有时候有时候研究者也会其他的角度去测量变量之间的关系,比如按性别分类,而性别的分数则不是数字。这种类型的数据通常用于个体的分类,因此通常与个体的其他数字分数一起使用。这种组合使用的技术(以表格的形式出现的方式)通常被称为 chi-square test,如下图:
Correlational Method 的局限性
相关性方法通常只能体现关系的存在性,但并不能解释为什么会有这种存在性,也不能证明两者存在因果关系。比如学生成绩下降,可能是因为晚睡导致,但也可能不是因为晚睡导致;也没有办法证明早睡会让学生的成绩上升。
相关性研究方法简直就是人类想当然的思维方式 

Experimental and Nonexperimental Methods
为了证明两个变量存在因果关系(cause-and-effect relationship),我们引入了实验/非实验性方法(Experimental and Nonexperimental Methods)。这种方法通过比较组之间的分数来判断两个(或多个)变量之间的关系。具体的来讲,这类方法通常分两个步骤:
- 使用第一个变量来分组
- 使用第二个变量来获得每组的分数
来看一个具体的例子。
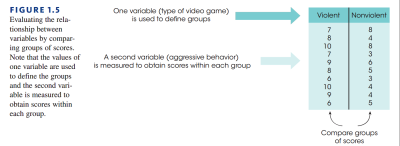
我们希望研究这么一个问题:对于十岁左右的孩子来说,玩暴力电视游戏会不会导致暴力的行为。下面使我们如何应用上述的方法:
- 首先我们使用第一个变量(是否玩暴力电视游戏)定义两个组。
- 其次我们计算每个组的分数,并将其进行对比。这里的分数针对第二个变量,也就是暴力行为的频率。
Experimental and Nonexperimental Methods
用于比较组之间关系的研究方法主要有两种:实验研究法(Experimental Method)和非实验研究法(Nonexperimental Methods)。这两者的主要区别在于,前者可以解释变量之间的因果关系,但后者只能解释相关性,即我可以说一个变量随着另外一个变量化,但我们不知道为什么。
The Experimental Method
实验研究法的目标是解释变量之间的因果关系,也就是改变一个变量会导致另外一个变量的改变。为了达到这个目标,实验研究法需要满足两个要求:
- 操纵(Manipulation):研究者可以通过改变变量的值来操纵变量。
- 控制(Control):研究者必须保证其他无关紧要变量不影响实验结果。
我们之前谈到的例子中,我们操纵了变量游戏的类型(暴力与非暴力),而我们观察的变量是攻击性行为。而之于这两者之外可能会影响到被观察变量的变量,必须要被控制。这种类型的变量又分为两类:
- 参与者变量(Participant variable):参与者变量指在实验中,实验个体自带的特征。比如上述实验中,十岁的孩子自带性别的变量。如果我们将上面的组按性别来分,即一组男生与一组女生,那么这个实验就违反了实验研究法需要满足的第二个条件:控制。实验者必须保证参与者变量在组之间是相同的;否则这样的行为会导致对实验结果的解释会不止一种,比如上述实验中如果按男女分组,我们就可以解释说性别也对暴力性行为有影响。这样的解释导致的就是我们无法得到一个没有歧义的结论,也就是所谓的 Confounded。
- 环境变量:(Environmental variables):与实验个体无关的一些条件,比如天气,光照,时间等等。实验者同样必须确保不同实验组具有同样的环境变量;比如上述实验中,如果两组实验不在同时一时间 / 天气下进行,我们就无法判断环境原因导致攻击性行为频率不同。
那么如何尽量消除这些变量的影响呢?我们有下面几种方法可以采用:
- Random assignment:也就是确保每个参与者被分到对应的组的概率相同。比如上述例子中如果实验的时间分早上和晚上,那么就要尽量将参与者平均分配到这两段时间中。
- Matching:尽量保证其他变量相同,比如上述实验中只挑十岁的孩子进行实验,或者明确的确定参与实验中孩子的性别比例。
In the experimental method, one variable is manipulated while another variable is observed and measured. To establish a cause-and-effect relationship between the two variables, an experiment attempts to control all other variables to prevent them from influencing the results.
实验研究法中的术语
- 自变量(Independent variable):也就是实验者操纵的变量。
- 因变量(Dependent variable):实验者观察的变量。
The independent variable is the variable that is manipulated by the researcher. In behavioral research, the independent variable usually consists of the two (or more) treatment conditions to which subjects are exposed. The independent variable consists of the antecedent conditions that were manipulated prior to observing the dependent variable.
The dependent variable is the one that is observed to assess the effect of the treatment.
* Control Conditions in an Experiment :我们需要注意到在实验研究方法中,实际上只有一个变量用于测量(这也是实验方法与相关性方法的最大区别之一)。通常情况下,我们会将实验组分为两组:一组应用变量,一组不应用变量,然后通过对照两组实验的区别得出结论。在这中类型的实验中,我们称:没有应用变量的条件为 Control condition,而应用变量的条件称为 Experimental condition。
Individuals in a control condition do not receive the experimental treatment. Instead, they either receive no treatment or they receive a neutral, placebo treatment. The purpose of a control condition is to provide a baseline for comparison with the experimental condition.
Individuals in the experimental condition do receive the experimental treatment.
Nonexperimental Methods
通过对实验研究方法的研究,我们明白一个实验必须要满足一下几个条件:
- 操作自变量
- 观察因变量
- 控制其他变量
不过有些情况下,一些研究并不满足上述条件,但依然可以通过比较实验组之间的分数(统计量)来反映变量之间的关系。我们称这种类型的研究(实验)为非实验研究方法(Nonexperimental Method)。来看看两个具体的例子:
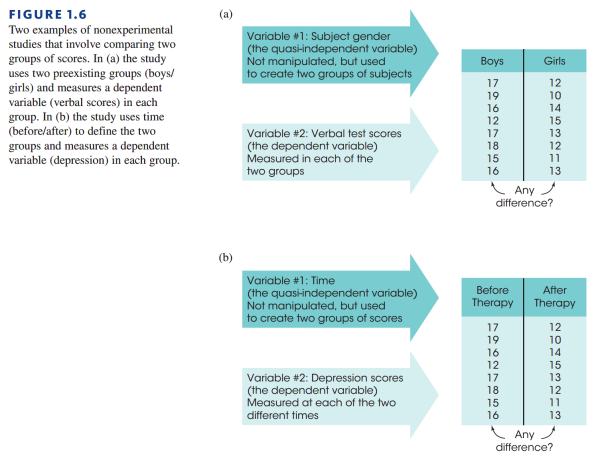
上图第一个例子中,我们将实验组分为了男生组与女生组,我们注意到这个分组我们是没有办法操纵的(比如我们就没有办法使用 random assignment 将男生女生平均分配到两个组内)这样的分组我们称之为不等同组(Nonequivalent groups)。这种类型的实验组还有很多例子,比如比较八岁和十岁的孩子,比较有进食障碍或者没有进食障碍的人,比较单亲家庭与双亲家庭的孩子等等。
再来看看上图中的第二个例子:我们将两组病人按吃药和没吃药分作两组,观察吃药前后的抑郁程度。但我们注意到,我们没有办法控制一个变量:时间。我们意识到“吃药前”一定是发生在“吃药后”之前的,因此即便是病人们服用了药物后抑郁症有所缓解,我们也不能确定这种缓解是由药物导致的还是时间导致的。这种研究被称为 Pre-post study。
非实验研究法中的术语
在上面的例子中,我们注意到非实验方法中也同样存在自变量与因变量。但有一点与实验研究法不同的是,非实验研究法中的自变量并不是真正的自变量,因为实验者不能操纵该变量。我们把这样的变量称为准自变量(\\Quasi-independent variable\\)。
In a nonexperimental study, the “independent variable” that is used to create the different groups of scores is often called the quasi-independent variable.
Variables and Measurement
Constructs and Operational Definitions
在某些实验中我们我们注意到这么一些变量:比如研究学生成绩好与智商的关系中的“智商”;人饿的时候是否更能集中注意力的 “饿”。相比起身高、体重这种能用数字直接描述的变量,“智商”、“饿”这类的概念更加抽象,并没有办法直接观测到。不过,我们依然可以使用这样的变量来描述和解释行为。我们将这类型的属性称之为抽象概念(Construct)。
当然,即便是这些概念没有办法观测,我们也可以发明一套程序来测量这些概念/行为,使用测量得到的结果来衡量这些抽象概念。比如我们没有办法直接描述人的智商,但我们可以通过设计一系列的智商测试来得到一个数,并用该数来衡量实验个体的智力强弱。我们将这套用于度量抽象概念的程序过程称为操作定义(Operational definition)。
Constructs are internal attributes or characteristics that cannot be directly observed but are useful for describing and explaining behavior.
An operational definition identifies a measurement procedure (a set of operations) for measuring an external behavior and uses the resulting measurements as a definition and a measurement of a hypothetical construct. Note that an operational definition has two components. First, it describes a set of operations for measuring a construct. Second, it defines the construct in terms of the resulting measurements.
Discrete and Continuous Variables
先来看看一个变量:我们扔一个骰子,我们能得到的变量值只有 ${1,2,3,4,5,6}$。这样的变量我们称为离散变量(Discrete Variables)。离散变量最大的特点就是其变量值是可以计算的数字;换句话说,在其两个变量值之间没有中间值。
A discrete variable consists of separate, indivisible categories. No values can exist between two neighboring categories.
比如上述的骰子,我们就不能观测到一个 $1,2$ 之间的值。
再来看看另外一种变量:比如人的身高:人的身高是可以无限细分的;也就是说,我们可以在任何两个身高值之间再找出一个身高值。我们将这样可以无限细分的变量称为连续变量(Continuous Variables)。
For a continuous variable, there are an infinite number of possible values that fall between any two observed values. A continuous variable is divisible into an infinite number of fractional parts.
根据连续变量的定义,我们很容易得到连续变量的两个特点:
- 我们基本上不可能得到两个完全相同的连续变量的测量结果:连续变量拥有无限多的可能值。比如两个人的身高是基本不可能完全相同的。
- 当我们测量连续变量的时候,我们的测量结果被视作为一个区间(Interval)。假设我们测量出两个学生的体重都为150磅;看上去这两个学生的体重是相等的,实际上这两个学生的体重只是近似相等的。如果我们测量的精度设置为
0.1磅,那么很可能这两个学生就有不同的体重了。那么如果精度是1磅,我们如何判断体重是 149 还是 150 磅呢?我们可能会设置这么一个区间:体重在 149.5 磅 到 150.5 磅之间的,我们都认为是 150 磅。所以150 磅并不代表一个指定的分数,而是一个分数的区间。而上述的 $[149.5, 150.5]$ 这个区间,我们称为组限 (Real limit)。其中149.5称为下组限(lower real limit),而150.5称为上组限(upper real limit)。
Real limits are the boundaries of intervals for scores that are represented on a continuous number line. The real limit separating two adjacent scores is located exactly halfway between the scores. Each score has two real limits. The upper real limit is at the top of the interval, and the lower real limit is at the bottom.
需要注意的是,离散与连续都是指的变量本身,而不是测量方法。在对连续变量的测量中,测量的结果往往显示为离散的数字。我们可以通过看变量是否能够无限细分来判断该变量是离散的还是连续的。
Scale of Measurement
在测量数据的过程中,我们需要用某种类别来进行测量:比如身高,我们可以用高、中、矮来测量与描述,也可以用具体的身高数字来描述。而不同的测量类别会构成不同的测量尺度(Scale of Measurement)。不同测量尺度之间的区别是非常重要的,其直接反应了每一种测量方式的局限性。更重要的是,某一些测量需要指定的测量尺度。比如身高,如果研究者想通过指定的身高来区分实验组,那么高中矮这样的测量尺度就是不适用的。
The Nominal Scale
如果一个测量尺度区分的类别只有名字上的不同,没有先后次序,那么我们将这样的测量尺度称为类别量表(Nominal scale)。比如测量学生的专业,就是通过一个类别量表来测量的:比如专业按艺术、生物、计算机来区分;这样的类别只有名字上的不同。但需要注意的是,类别量表只能通过名字来区分实验组的不同;使用类别量表进行数量上的比较都是没有意义的,比如你不能认为计算机专业比生物专业“大”。
A nominal scale consists of a set of categories that have different names. Measurements on a nominal scale label and categorize observations, but do not make any quantitative distinctions between observations.
The Ordinal Scale
如果一个测量尺度区分出来的类别不仅有名字的区别,而且有确定的大小顺序,那么我们称这样的测量尺度为顺序量表(The Ordinal Scale)。
顺序量表通过顺序来描述两个实验组(个体)之间的不同。比如星巴克的纸杯,我们可以用“大”、“小”来对其分类。但顺序量表并不能描述具体的大小;也就意味着当我们需要知道星巴克的“大”纸杯比“小”纸杯大多少时,顺序量表并不能告诉我们这之间的差别。因此,我们通常使用顺序量表来描述一些很难用数字去描述的变量。
An ordinal scale consists of a set of categories that are organized in an ordered sequence. Measurements on an ordinal scale rank observations in terms of size or magnitude.
The Interval and Ratio Scales
如果我们在顺序量表的基础上增加一个要求,即不同类别之间的间隔相等,那么我们可以得到一种类似于尺子的测量尺度;也就是说,这个测量尺度不仅包括了顺序,而且包括了区间。根据对该间隔(区间)的定义的不同,我们可以将该测量尺度分为两种:
- 等距量表(The Interval Scale):使用具体的数量作为间隔,比如温度表
- 等比量表(The Ratio Scale):使用成比例的数量作为间隔,比如长度
这两者的区别主要在于等距量表拥有任意的原点,而等比量表只拥有一个唯一的自然零点。这个区别可以解释为:等距量表上的零点是有意义的,可以用于测量;比如温度中的 0 度并不意味着温度不存在;而在摄氏和华氏温度中,零点所代表的温度实际上也是不一样的。
相比之下,等比量表中的零点则不是任意的,而是绝对的。比如距离为 0 则代表了两者之间没有距离。我们可以将等比量表中的 0 认为是一个衡量的基础,这使得我们可以使用比例来诠释数据之间的不同,比如 5 加仑的水就是比 0 多 5 加仑,而 10 加仑的水就比 0 加仑 多 10 加仑。
An interval scale consists of ordered categories that are all intervals of exactly the same size. Equal differences between numbers on scale reflect equal differences in magnitude. However, the zero point on an interval scale is arbitrary and does not indicate a zero amount of the variable being measured.
A ratio scale is an interval scale with the additional feature of an absolute zero point. With a ratio scale, ratios of numbers do reflect ratios of magnitude.
Statistical Notation
Scores
- 单个实验组包含单组分数:$X$
- 单个实验组包含多组分数:$X、Y$
- 单个实验组(总体)中包含的分数总数:$N$
- 单个实验组(样本)中包含的分数总数:$n$
Summation Notation
我们使用求和符号表示对一组数据的求和:$\sum X$
求和表达式中的计算顺序
- 括号内的永远先计算
- 乘方
- 乘除
- 求和符号
- 加减
